

SECTION A
MSHCP CONSERVATION AREA DESCRIPTION
1.0 INTRODUCTION
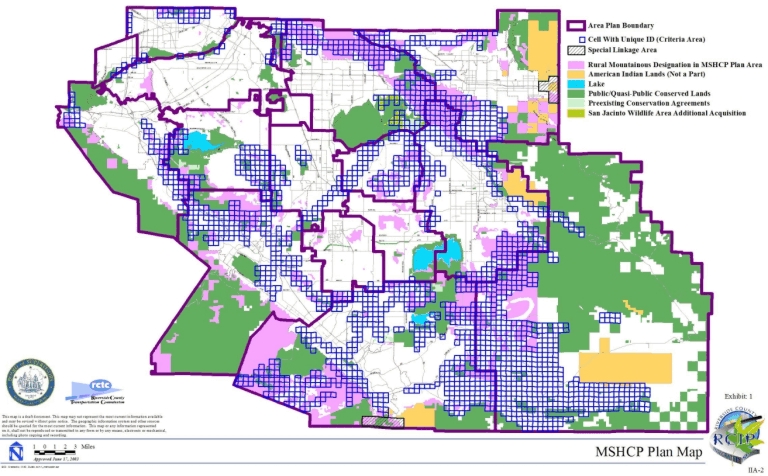
This document presents a description of the MSHCP Conservation Area expected to be assembled over time based on the Criteria and assurances incorporated in the MSHCP. Exhibit 1 depicts the overall MSHCP Conservation Area Criteria Area boundaries within the Plan Area; i.e., the MSHCP Plan map. Four categories of MSHCP Conservation Area planning, land use, and land ownership are depicted in the legend of the Plan map and are described below.
Criteria Area: This represents the area within which MSHCP Criteria will be applied and from which approximately 153,000 acres of new Conservation will be achieved to contribute toward assembly of the overall MSHCP Conservation Area. Conservation Criteria have been developed for individual 160-acre U.S. Geological Survey (USGS) map quarter section Cells (i.e., areas legally defined by section, township and range) or Cell Groupings.
Public/Quasi-Public Lands: Under this category, existing known Public/Quasi-Public Lands that will be the foundation of the MSHCP Conservation Area are depicted. It is assumed that these lands will be managed for their biological resources, including Vegetation Communities, Habitats and species. Approximately 347,000 acres of Conservation are anticipated on these lands.
Rural/Mountainous Designation: The Rural/Mountainous Land Use designation is incorporated in the County General Plan. These lands generally are characterized by steep slopes that represent intrinsic constraints to Development. While the MSHCP Conservation Area assembly is not expected to occur in the Rural/Mountainous designation outside of the Criteria Area, it is expected that existing and future land use practices in these areas provide some additional Conservation value along the edge of the MSHCP Conservation Area and for Habitat connectivity.
Indian Lands: Indian Lands are depicted on the MSHCP Plan map for reference only. No Conservation is assumed on these lands.
The following sections provide a general description of the MSHCP Conservation Area. Section 2.0 provides a general overview of the Plan Area in terms of the geographic and Conservation planning setting, climate, and Bioregions. Section 3.0 describes the MSHCP Conservation Area in terms of Vegetation Communities, Conservation within the different Bioregions as a measure of diversity and representativeness, Conservation of selected soils that support listed and sensitive plant species, Conservation of federally designated and proposed critical Habitat for several listed wildlife species, and Habitat patch size, shape and Edge Effects.
2.0 OVERVIEW OF MSHCP PLAN AREA
2.1 Physiography
The MSHCP Plan Area is situated in the western one-third of Riverside County and spans approximately 40 miles from north to south and 70 miles from east to west. The Plan Area is bounded by Orange County and the Santa Ana Mountains to the west and southwest, San Bernardino County and the San Bernardino Mountains to the north, the San Jacinto and Santa Rosa mountains to the east, and San Diego County and the Agua Tibia Mountains to the south.
The Plan Area encompasses approximately 1,258,800 acres generally bounded by the Peninsular and Transverse Mountain Range provinces (Exhibit 2). The Transverse Ranges trend east to west, one of the only mountain ranges in North America with such an orientation. This mountain range system lies in a narrow strip west from Santa Barbara east to approximately Joshua Tree National Monument of the Mojave Desert. The Transverse Ranges largely form the northern boundary of the Plan Area, although the San Bernardino Mountains of this system intersect the Plan Area only in the northeast corner in the area of Banning and Morongo (Exhibit 2). Most of the Plan Area lies in the Peninsular Range Province, which extends in a north-south orientation and stretches along the coastline north from the Transverse Range province and the Los Angeles Basin southward to the tip of Baja, Mexico. Within the Plan Area, the San Jacinto, Santa Rosa, and Santa Ana Mountain ranges form the Peninsular Range province (Exhibit 2). The San Jacinto Mountains reach elevations over 8,000 feet within the Plan Area, with Mt. San Jacinto the highest peak in this system at 10,805 feet just outside the eastern boundary of the Plan Area. Elevations in the Santa Ana Mountains along the western edge of the Plan Area are less dramatic, reaching heights of about 4,000 feet.
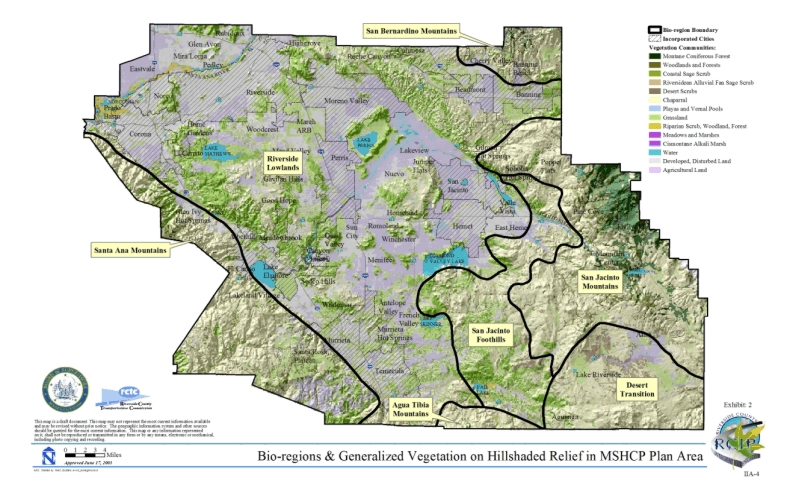
A central area mainly composed of lowlands and plains lies inward from the mountainous borders of the Plan Area. The predominant lowland feature of this area is the Perris Plain, which cuts a wide swath punctuated with rocky outcrops and low hills and mountain ranges from Corona to Hemet. Other smaller valleys, hills, and low mountain ranges also occur in this central area.
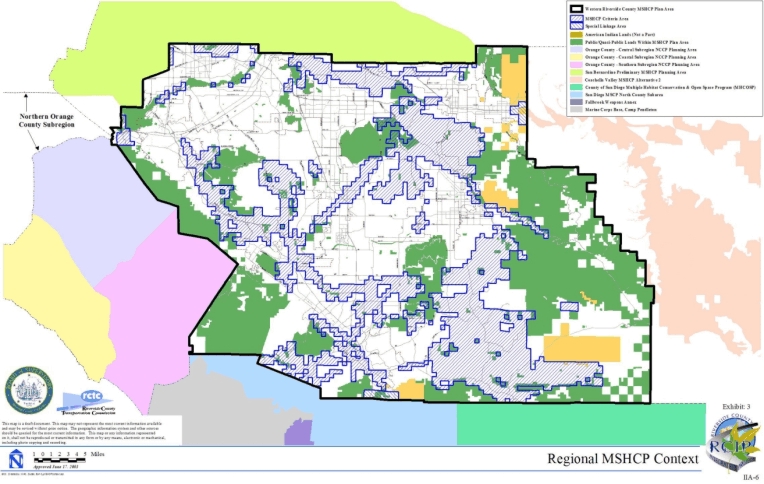
2.2 Conservation Planning Context
The MSHCP Plan Area is bounded on the north, east, south and southwest by Public/Quasi-Public Lands and other various conservation planning efforts (Exhibit 3). The Plan Area is bounded on the north by the San Bernardino County Preliminary MSHCP Plan Area and San Bernardino National Forest, on the east by the San Bernardino National Forest and the Coachella Valley MSHCP, on the south by the Cleveland National Forest and San Diego Multiple Habitat Conservation and Open Space Program, and on the southwest by MCB Camp Pendleton, Cleveland National Forest, the Central Orange County Subregion NCCP and the Southern Orange County Subregion NCCP.
2.3 Climate
Latitude, topography, and the influence of the nearby Pacific Ocean produce a Mediterranean climate in the Plan Area, consisting of warm, dry summers and mild, wet winters. However, at a local level, the Plan Area exhibits substantial climatic variation, resulting in high biotic diversity. For example, average January high temperatures in the Plan Area range from 54o Fahrenheit (F) in Idyllwild in the San Jacinto Mountains to 65o F in the City of Riverside in the northwest corner of the Plan Area. Nighttime lows in January and February often drop below freezing throughout the Plan Area. July high temperatures range from 96o F in the northeastern edge of the Plan Area near Beaumont and Banning to 72o F in the Santa Ana Mountains in the southwest corner of the Plan Area. Low altitude areas, however, have long mid-summer stretches of daily highs exceeding 1100 F. Average annual precipitation ranges from 26 inches near Idyllwild in the San Jacinto Mountains, to approximately 10 inches in the Riverside and Moreno Valley areas. Typical rainfall in the Plan Area is 10 to 15 inches per year.
2.4 Bioregions
The various interactions between the Plan Area's diverse abiotic landforms, climate and weather patterns (e.g., prevailing winds, precipitation, temperature) and biotic systems are complex and difficult to analyze on a unified regional scale. To aid in the analysis and discussion of these abiotic and biotic features and phenomena, smaller scale "Bioregions" were defined to represent areas with similar physical and biological features. The Bioregions provide a framework for describing the MSHCP Conservation Area in terms of areas likely to function in a similar manner. Also, the Bioregions provide a way of assessing the spatial and functional representativeness of the MSHCP Conservation Area.
It is important to understand that a comprehensive analysis of the complex interactions between abiotic and biotic features in the Plan Area largely is beyond the scope of this Conservation. An important component of the Adaptive Management program will be continued study of these issues, which will require scientists from many different disciplines such as physiological ecology, soil science and climatology. At this point, the Bioregions are intended to provide a first-cut, coarse-grain portrayal of the natural systems in the Plan Area.
The Bioregions were developed using existing elevation (30-meter digital elevation model [DEM] data), topography (hill shaded DEM mapping), soils (Soil Conservation Service), and local expertise on floristic distributions. As illustrated in Exhibit 2, seven general Bioregions were identified in the Plan Area: Santa Ana Mountains, Agua Tibia Mountains, Riverside Lowlands, San Jacinto Foothills, San Jacinto Mountains, Desert Transition, and San Bernardino Mountains. The definitions for the regions are outlined below.
1. Santa Ana Mountains Bioregion
- Elevation generally > 2,000 feet. Lower elevations near the Santa Rosa Plateau and Alberhill were included because of floristic similarities.
- Indicative vegetation types include Diegan coastal sage scrub, mesic chaparral, sparse coniferous vegetation.
- Heavily influenced by coastal climate (fog, rainfall, wind etc.).
- Low disturbance and urban influence.
2. Agua Tibia Mountains Bioregion
- Elevation generally > 2,000 feet.
- Indicative vegetation types include Diegan coastal sage scrub, mesic chaparral, sparse coniferous vegetation.
- Low disturbance and urban influence.
- Less coastal influence.
- Unique flora.
3. Riverside Lowlands Bioregion
- Elevation generally < 2,000 feet. Estelle Mountain, Gavilan Hills, and Lakeview Mountains were included based on floristic similarities to lower elevation areas.
- Indicative vegetation types include Riversidean sage scrub and annual grasslands.
- Relatively arid and within the Santa Ana Mountains' rain shadow.
- Higher disturbance, Habitat fragmentation and urbanization.
4. San Jacinto Foothills Bioregion
- Elevation between 2,000 and 3,000 feet.
- Indicative vegetation types include Riversidean sage scrub and xeric chaparral associations.
- Less frequent frosts than mountains, snow rare.
- Low disturbance and urban influence.
5. Desert Transition Bioregion
- Elevation > 3,000 feet.
- Indicative vegetation types include red shank chaparral, Big Basin sage scrub, semi-desert chaparral, semi-desert scrub.
- Arid, desert-influenced.
- Low disturbance and urban influence.
6. San Jacinto Mountains Bioregion
- Elevation > 3,000 feet.
- Indicative vegetation types include coniferous forests, montane chaparral, broad-leafed forests.
- Unique flora distinct from San Bernardino Mountains Bioregion.
- Low disturbance and urban influence.
7. San Bernardino Mountains Bioregion
- Elevation > 3,000 feet.
- Indicative vegetation types include coniferous forests, montane chaparral, broad-leafed forests.
- Unique flora distinct from San Jacinto Mountains Bioregion.
- Low disturbance and urban influence.
3.0 MSHCP CONSERVATION AREA DESCRIPTION
3.1 Generalized Vegetation
3.1.1 Methodology
The vegetation data base was developed by Pacific Southwest Biological Services (PSBS 1995) based on 1992-1993 aerial photographs. The acreage and spatial distribution of Vegetation Communities in the Plan Area are a useful method or surrogate for assessing the biotic representativeness, diversity and function of the MSHCP Conservation Area. For example, a conservation area would be considered representative of the existing biotic conditions in the Plan Area if all of the distinct vegetation types were represented in the MSHCP Conservation Area in proportions similar to their representation in the larger Plan Area. Representativeness of Vegetation Communities itself is a surrogate or index for biotic diversity in the absences of diversity measurements at a finer-grained scale (e.g., the diversity of plant and wildlife families, genera or species). Tying representativeness to biological or ecosystem function (i.e., adequate conservation), however, is much more difficult. Representativeness may be a necessary, but not sufficient, condition to ensure ecosystem function.
At this point, it also is useful to distinguish between "Vegetation Communities" and "Habitats." The terms often are used interchangeably, but a Vegetation Community precisely refers to definable and consistent assemblages of plant species, whereas Habitat is the native environment of a plant or animal species. An attempt will be made throughout this document to use these terms in their proper context, but at times the distinction between the two becomes blurred. For example, coastal sage scrub is both a Vegetation Community and a Habitat. Furthermore, when using Vegetation Communities as a surrogate for representativeness, it may be used in the context of representativeness of Vegetation Community diversity and function as well as Habitat diversity and function for plant and wildlife species.
The usefulness of the vegetation community data to assess representativeness, diversity and function depends on several assumptions, of which the most important include the following:
- The vegetation classification system accurately represents existing Vegetation Communities in the Plan Area and reflects biologically meaningful differences in species composition or wildlife Habitat characteristics
- The mapping is reasonably accurate in that few mistakes were made in the shape or classification of vegetation types; and
- The classification system and mapping scales were applied consistently throughout the Plan Area.
The mapping classification used in the Plan Area is based on the Holland (1986) terrestrial vegetation descriptions for California. These descriptions are widely used by professional biologists involved in vegetation mapping both at the local and landscape level and generally are accepted by jurisdictions and the resources agencies to represent Vegetation Communities, although many jurisdictions have adopted modified classification systems that are more appropriate for their geographical area. However, the Holland system is not a true quantitative classification system in that is does not have a quantitative rules system for differentiating between vegetation stands. Furthermore, the Holland descriptions have not been formally tested for their ability to represent biologically meaningful differences in plant or animal species composition. On the other hand, because variation in the distribution of most plant and animals has been demonstrated to be somewhat continuous (e.g., Whittaker 1975), it is doubtful that a more rules-based classification would prove any more effective for regional-scale landscape analysis. Based on its current acceptance in the profession, it is appropriate to use Holland's vegetation classifications to describe the distribution of different plant and animal species in the Plan Area.
With regard to the accuracy of the Vegetation Communities map, it must be stated that no objective measurement of the accuracy of the map has been performed (which would require at minimum a stratified, pseudo-random sampling program to determine an error rate), and therefore no valid conclusions can be drawn regarding the accuracy of the map on a polygon-by-polygon basis. Although the coastal sage scrub and adjacent vegetation polygons were field-verified by PSBS, the remainder of the vegetation polygons not were not systematically field-verified. PSBS conducted a subjective accuracy assessment using a variety of existing vegetation maps (e.g., the Weislander VTM, CNDDB, and UCR-Minnich maps) and found an acceptable correspondence to the other maps. Although the accuracy of the vegetation data has not been quantitatively tested, it has been qualitatively evaluated at an appropriate level of accuracy for this landscape-level analysis.
The focus for the vegetation mapping by PSBS was largely for coastal sage scrub conservation planning. Thus, it is likely the mapping scale and consistency in classification are adequate for this Vegetation Community. Because the minimum mapping unit of this mapping effort was between approximately one and five acres, it is unlikely that other vegetation type polygons were consistently mapped below one acre. Furthermore, generalizations in vegetation classification and polygon size appear to have been made in areas with widespread vegetation types and smaller units were difficult to determine by aerial photography. For example, large tracts of chaparral in the Plan Area are known to support several different chaparral subassociations, as described by Holland (1986) (e.g., chamise chaparral, scrub oak chaparral, Ceanothus crassifolius chaparral, and interior live oak chaparral), but large areas of chaparral were lumped in a general undifferentiated chaparral category. In contrast, coastal sage scrub was mapped as several different associations: Diegan coastal sage scrub, Riversidean sage scrub, Riversidean alluvial fan sage scrub, and disturbed alluvial scrub. As a result of different precision and scales of mapping, there likely is some variation in the representation of species turnover or diversity at the boundaries of different polygons within and between Vegetation Community types. For the purpose of the MSHCP Conservation Area description, the Vegetation Communities are generalized to broader physiognomic formations, resulting in less specific information about the different associations, but yielding a more valid landscape-level analysis.
3.1.2 MSHCP Conservation Area Vegetation Description
Table 1 shows, in order from highest to lowest, the acreages of Vegetation Communities and land covers that would be conserved in the MSHCP Conservation Area (including existing Public/Quasi-Public Lands). Exhibit 4 shows the distribution of Vegetation Communities in the Plan Area and MSHCP Conservation Area. Approximately 90% of the MSHCP Conservation Area consists of five generalized vegetation types: chaparral, coastal sage scrub, grassland, woodlands and forests, and montane coniferous forests. Among these, chaparral occupies the largest area, covering approximately 54% of the MSHCP Conservation Area. Agricultural lands make up about 4% of the area, and the remaining generalized vegetation types comprise less than 8% of the MSHCP Conservation Area.
TABLE 1
ACREAGE OF GENERALIZED VEGETATION COMMUNITIES
TO BE CONSERVED WITHIN THE MSHCP CONSERVATION AREA
| Vegetation Community | MSHCP Conservation Area (Acres) |
Percentage Conserved |
Cumulative Percentage |
|---|---|---|---|
| Chaparral | 272,280 | 54.5 | 54.5 |
| Coastal Sage Scrub | 81,720 | 16.3 | 70.8 |
| Grassland | 42,820 | 8.6 | 79.4 |
| Woodlands and Forests | 23,500 | 4.7 | 84.1 |
| Montane Coniferous Forest | 20,500 | 4.1 | 88.2 |
| Agricultural Land | 20,020 | 4.0 | 92.2 |
| Riparian Scrub, Woodland, Forest | 11,190 | 2.2 | 94.4 |
| Playas and Vernal Pools | 6,750 | 1.3 | 95.7 |
| Water | 10,340 | 2.1 | 97.8 |
| Riversidean Alluvial Fan Sage Scrub | 5,230 | 1.0 | 98.8 |
| Desert Scrubs | 4,990 | 1.0 | 99.8 |
| Meadows and Marshes | 510 | 0.1 | 99.9 |
| Cismontane Alkali Marsh | 40 | <0.1 | 100.0 |
| TOTAL1 | 499,890 | 100.0 | |
| 1 Approximately 1,240 acres in the MSHCP Conservation Area are mapped as "unknown." This acreage is omitted from this analysis. Developed also is omitted from the table because it does not contribute to the MSHCP Conservation Area. | |||
Although most of the MSHCP Conservation Area is comprised of relatively few generalized vegetation types, it does represent the distribution of generalized vegetation types within the entire Plan Area, as illustrated by the comparison in Table 2 of the relative percent distribution in the MSHCP Conservation Area and the relative percent distribution in the Plan Area. For example, the relative distribution of chaparral in the MSHCP Conservation Area is 55% of the total acreage in the area, whereas it comprises only 42% of the Plan Area. On the other hand, grassland comprises 15% of the Plan Area, but only 9% of the MSHCP Conservation Area. Thus, if a conservation goal is to provide a typical representation of a vegetation type in the MSHCP Conservation Area (i.e., representativeness) as an index of diversity, chaparral is "over-represented" by approximately 12% and grassland is under-represented by more than 6%. It is important to understand that the relative percentages are arithmetically dependent. That is, purposely omitting large areas of Agriculture from the MSHCP Conservation Area will tend to cause the other relative percentages to increase. Generally, it is desirable to have neutral to positive changes in the relative percentages of the natural Vegetation Communities. Negative changes indicate that proportionally less of a community would be conserved.
TABLE 2
VARIATION IN RELATIVE DISTRIBUTION
OF VEGETATION COMMUNITIES BETWEEN AREAS
TO BE CONSERVED UNDER THE MSHCP AND THE PLAN AREA
| Vegetation Community | MSHCP Conservation Area |
Plan Area | Percent Conserved under MSHCP |
Change in Relative % Distribution |
||
|---|---|---|---|---|---|---|
| Acres | Relative % Distribution |
Acres | Relative % Distribution |
|||
| Chaparral | 272,280 | 54.5 | 434,930 | 41.9 | 62.6 | 12.6 |
| Coastal Sage Scrub | 81,720 | 16.3 | 156,440 | 15.1 | 52.2 | 1.2 |
| Grassland | 42,820 | 8.6 | 154,140 | 14.8 | 27.8 | -6.2 |
| Woodlands and Forests | 23,500 | 4.7 | 34,320 | 3.3 | 68.5 | 1.4 |
| Montane Coniferous Forest | 20,500 | 4.1 | 29,910 | 2.9 | 68.5 | 1.2 |
| Agricultural Land | 20,020 | 4.0 | 169,460 | 16.3 | 11.8 | -12.3 |
| Riparian Scrub, Woodland, Forest | 11,190 | 2.2 | 15,030 | 1.4 | 74.5 | 0.8 |
| Playas and Vernal Pools | 6,750 | 1.4 | 7,920 | 0.8 | 85.2 | 0.6 |
| Water | 10,340 | 2.1 | 12,210 | 1.2 | 84.7 | 0.9 |
| Riversidean Alluvial Fan Sage Scrub | 5,230 | 1.0 | 7,940 | 0.8 | 65.9 | 0.2 |
| Desert Scrubs | 4,990 | 1.0 | 14,560 | 1.4 | 34.3 | -0.4 |
| Meadows and Marshes | 510 | 0.1 | 1,020 | 0.1 | 23.7 | 0.0 |
| Cismontane Alkali Marsh | 40 | <0.1 | 1,260 | 0.1 | 3.2 | 0.0 |
The over-representation of chaparral, coastal sage scrub, and montane coniferous forest occurs because high absolute percentages of these communities are conserved and because relatively low percentages of grasslands and agricultural lands are conserved. Most of the vegetation types show a slight over-representation. The only Vegetation Community that shows substantial under-representation is grassland. Desert scrubs show a slight under-representation. Because agricultural lands have lower conservation value, under-representation is not important. A more fine-scaled analysis of under-represented vegetation types is provided at the end of this section.
3.2 Uncollapsed Vegetation
Although the vegetation classifications in the uncollapsed vegetation data base contain some inconsistences, they are the best available resource to describe the representation of the largest variety of vegetation associations (including rare types). Approximate acreages for the uncollapsed vegetation types mapped within the Plan Area and the MSHCP Conservation Area are presented in Table 3.
TABLE 3
CONSERVATION OF UNCOLLAPSED VEGETATION TYPES
| Vegetation Community | Plan Area (Acres) |
MSHCP Conservation Area (Acres) |
Percent Conserved |
|---|---|---|---|
| Lodgepole Pine | 578 | 578 | 100.0 |
| Montane Riparian Scrub | 6 | 6 | 100.0 |
| Subalpine Coniferous | 27 | 27 | 100.0 |
| Tamarisk Scrub | 272 | 272 | 100.0 |
| Southern Interior Basalt Vernal Pool | 55 | 55 | 100.0 |
| Black Oak Forest | 8 | 8 | 100.0 |
| Arundo/Riparian Forest | 493 | 491 | 99.6 |
| Semi-desert Succulent Scrub | 2,430 | 2,356 | 97.0 |
| Unknown Woodland | 199 | 193 | 97.0 |
| Broadleaved Upland Forest | 2,375 | 2,280 | 96.0 |
| Valley and Foothill Grassland | 2,736 | 2,626 | 96.0 |
| Sonoran Wash Scrub | 21 | 20 | 95.2 |
| Coastal and Valley Freshwater Marsh | 391 | 366 | 93.6 |
| Vernal Pool | 19 | 17 | 89.5 |
| Southern Cottonwood/Willow Riparian | 6,759 | 5,943 | 87.9 |
| Mixed Evergreen Forest | 4,467 | 3,915 | 87.7 |
| Alkali Playa | 7,840 | 6,680 | 85.2 |
| Open Water/Reservoir/Pond | 12,206 | 10,339 | 84.7 |
| Southern California White Fir | 3,871 | 3,224 | 83.3 |
| Disturbed Alluvial | 1,393 | 1,116 | 80.1 |
| Montane Riparian Forest | 286 | 216 | 75.7 |
| Oak Woodland | 20,066 | 15,084 | 75.2 |
| Riparian Forest | 1,311 | 924 | 70.5 |
| Southern Riparian Woodland | 2 | 1 | 68.7 |
| Lower Montane Coniferous Forest | 7,688 | 5,007 | 65.1 |
| Chaparral | 362,837 | 233,212 | 64.3 |
| Riversidean Alluvial Fan Sage Scrub | 6,551 | 4,118 | 62.9 |
| Riparian Scrub | 3,346 | 2,091 | 62.5 |
| Dense Engelmann Oak Woodland | 4,110 | 2,429 | 59.1 |
| Jeffrey Pine | 13,274 | 7,749 | 58.4 |
| Sonoran Desert Scrub | 284 | 162 | 56.9 |
| Peninsular Juniper Woodland and Scrub | 1,082 | 609 | 56.3 |
| Red Shank Chaparral | 71,727 | 39,014 | 54.4 |
| Marsh | 87 | 47 | 54.2 |
| Riversidean Sage Scrub | 135,953 | 73,261 | 53.9 |
| Mule Fat Scrub | 651 | 338 | 51.8 |
| Southern Willow Scrub | 1,713 | 843 | 49.2 |
| Coast Live Oak Woodland | 6,660 | 3,083 | 46.3 |
| Diegan Coastal Sage Scrub | 15,816 | 6,561 | 41.5 |
| Coastal Scrub | 4,678 | 1,894 | 40.5 |
| Montane Meadow | 168 | 61 | 36.5 |
| Southern Sycamore/Alder Riparian Woodland | 190 | 69 | 36.5 |
| Non-native Grassland | 151,403 | 40,191 | 26.5 |
| Big Sagebrush Scrub | 11,852 | 2,471 | 20.8 |
| Chamise Chaparral | 358 | 53 | 14.7 |
| Wet Montane Meadow | 369 | 26 | 7.0 |
| Cismontane Alkali Marsh | 1,266 | 44 | 3.4 |
| Semi-Desert Chaparral | 19 | 0 | 0.0 |
| Dry Montane Meadow | 7 | 0 | 0.0 |
Forty-seven of the 49 mapped vegetation types are represented within the MSHCP Conservation Area (1,112 acres of unknown cover type is excluded from this analysis). The two vegetation types not represented in the area are dry montane meadow and semi-desert chaparral. However, both of these vegetation types comprise only small areas in the Plan Area: 19 acres for semi-desert chaparral and 7 acres for dry montane meadow. Assuming a somewhat arbitrary conservation threshold of 50%, 36 of the 49 vegetation types surpass this threshold. The apparent low conservation (i.e., < 50%) of several vegetation types may be misleading because the uncollapsed community may be redundant with another community that would be conserved at higher levels, or the community simply may be under-mapped in the Plan Area. These Vegetation Communities and others that are conserved at levels less than 50% are discussed below.
Big sagebrush scrub: A total of 2,471 acres of 11,852 acres (20.8%) in the Plan Area would be conserved under the MSHCP. An examination of the distribution of big sagebrush scrub shows that most of it occurs outside the MSHCP Conservation Area in the Anza Valley. Approximately 5,190 acres of big sagebrush scrub is on Indian Land and approximately 2,000 acres occur on private land north of Indian Land. Other patches of big sagebrush scrub up to 275 acres in size are scattered around the Anza Valley on private lands.
Chamise chaparral: A total of 53 acres of the mapped total of 358 acres (14.7%) would be conserved under the MSHCP. Seven patches of chamise chaparral were delineated within the Plan Area at Estelle Mountain, west of Steele Peak, Meadowbrook, southeast of Table Mountain, and in the Lakeview Mountains west of Hemet. The area not included in the MSHCP Conservation Area is located west of Steele Peak. The small acreage of mapped chamise chaparral in the Plan Area likely is an artifact of the variations in mapping used for compiling the vegetation map. Because of the difficulty in differentiating different subassociations of chaparral from aerial photography, many stands of chamise chaparral likely occur within the much larger "undifferentiated" chaparral category, which comprises 363,000 acres in the Plan Area. Chamise chaparral is a widespread vegetation type and chamise (Adenostoma fasciculatum) is a strongly dominant component of much of the chaparral in Western Riverside County. This relatively small area of chamise chaparral therefore should not be considered unique and its low level of Conservation is not a concern. When combined with undifferentiated chaparral, 64% (233,265 acres) of chaparral would be conserved under the MSHCP.
Cismontane alkali marsh: Only 44 acres of the 1,266 acres (3.4%) in the Plan Area would be conserved under the MSHCP. Cismontane alkali marsh was mapped in two general localities: along Cahuilla Creek on Indian Land in the Anza Valley adjacent to State Highway 371 and upstream from Lake Mathews along the Colorado River aqueduct. Approximately 1,066 acres of the cismontane alkali marsh occur on Indian Land in the Anza Valley. Several small patches of alkali marsh ranging in size from 10 to 75 acres occur on private land in the Anza Valley and a 14-acre patch is present east of Lake Mathews. Much of the largest mapped patches of cismontane alkali marsh would not be conserved under the MSHCP because of its occurrence on Indian Lands. However, cismontane alkali marsh commonly occurs in small patches within other riparian Vegetation Communities so it is possible that additional acreage may be conserved within the MSHCP Conservation Area. More detailed mapping would be necessary to determine the extent of this additional acreage and whether it would be biologically meaningful with regard to species Conservation and MSHCP Conservation Area function.
Coast live oak woodland: A total of 3,083 acres of 6,660 acres (46.3%) would be conserved in the MSHCP Conservation Area. About 1,670 acres of the coast live oak woodland that occur outside of the MSHCP Conservation Area are on lands designated as Rural/Mountainous regions and thus some additional Conservation of these areas would be likely. The remainder of coast live oak woodland occurs in private holdings or on Indian Lands. The lower Conservation of this Vegetation Community probably also is related to artifacts in the vegetation map classification. The geographic distribution of the more broadly defined "oak woodlands" vegetation type is frequently concurrent with coast live oak woodlands. Although this coarse vegetation description likely includes some higher elevation oak woodlands [e.g., those dominated by canyon live oak (Quercus chrysolepis), interior live oak (Quercus wislizenii) or black oak (Quercus kellogii)], much of its lower elevation distribution coincides with coast live oak woodland. It is likely that a large portion of the generalized oak woodland (probably 30 to 50%) is the same association as coast live oak woodland. Given that 75% of the more broadly defined oak woodlands would be preserved under the MSHCP, it is likely that the overall Conservation of coast live oak woodland is greater than 50%.
Dry montane meadow: None of the 7 acres of mapped as dry montane meadow would be conserved under the MSHCP. This vegetation occurs within one 7-acre patch located on Indian Land adjacent to the proposed MSHCP Conservation Area. However, dry meadow may be more widespread than indicated by the vegetation data base. Montane meadow is a similar vegetation type, although it is mapped as a separate community. Also, because dry montane meadow is typically limited to small patches, much of its distribution may not have been mapped. Small vegetation patches likely were not discernable because of the regional mapping scale; i.e., they tend to occur in patches less than the minimum mapping unit of about one acre based on aerial photo interpretation. The distribution of dry montane meadow thus probably is under-represented by the vegetation map. Additional acreage also may occur within the National Forest and thus would be considered conserved.
Diegan coastal sage scrub: A total of 6,561 acres out of 15,816 acres (41.5%) of Diegan coastal sage scrub would be conserved under the MSHCP. Diegan coastal sage scrub located outside of the MSHCP Conservation Area occurs in the southwestern and southern portions of the Plan Area along the base of the Santa Ana and Agua Tibia Mountain ranges and on the Santa Rosa Plateau between the Santa Rosa Plateau Ecological Reserve and the Santa Margarita Ecological Reserve. Other patches up to 210 acres in size occur on private lands east of the City of Temecula and south of Temecula Creek.
Montane meadow: A total of 61 acres of 168 acres (36.5%) of montane meadow would be conserved under the MSHCP. Montane meadows are distributed largely within the San Bernardino National Forest. Meadows outside the MSHCP Conservation Area largely occur on private inholdings within the National Forest and to a smaller extent on Indian Lands and Rural/Mountainous-designated lands. Montane meadow is a more general vegetation category that is analogous to dry montane meadow that is addressed above. Neither mapped type is well represented within the MSHCP Conservation Area. Smaller-sized patches of this vegetation type may exist in flatter areas near drainages within the National Forest. More detailed mapping would be required to determine any additional extent of montane meadow in the MSHCP Conservation Area.
Wet montane meadow: A total of 26 acres of 369 acres (7.0%) of wet montane meadow would be conserved under the MSHCP. The areas outside the MSHCP Conservation Area and existing private lands are comprised of numerous separate meadows ranging in size from approximately 13 acres to 187 acres located on private inholdings in the San Bernardino National Forest in the San Jacinto Mountains. Smaller-sized patches of this Habitat likely exist near drainages within the National Forest. More detailed mapping would be required to determine the extent of wet montane meadow in the MSHCP Conservation Area.
Non-native grassland: A total of 40,191 acres of 151,403 acres (26.5%) of non-native grassland would be conserved under the MSHCP. Most of the non-native grasslands outside of the MSHCP Conservation Area or existing Public/Quasi-Public Lands occur in relatively small, scattered patches on private lands distributed throughout the Plan Area. However, two prominent areas supporting relatively large, contiguous blocks of unconserved non-native grassland are the Banning-Beaumont area and the Anza Valley. The Banning-Beaumont area supports approximately 14,000 acres of grassland in at least five relatively large areas ranging in size from 1,000 to 6,000 acres. The Anza Valley supports at least two large, contiguous areas of grassland approximately 1,550 and 3,100 acres in size, about one-half of which occurs on Indian Lands.
Because non-native grasslands result from physical disturbance (fire, grazing, clearing, etc.) and are dominated by widespread non-native species, they are not intrinsically important reservoirs of native plant diversity. Non-native grasslands, however, are important for overall biological diversity because they provide important Habitat value for wildlife, including many sensitive animal species [e.g., Stephens' kangaroo rat (Dipodomys stephensi), San Diego black-tailed jackrabbit (Lepus californicus bennettii), grasshopper sparrow (Ammodramus savannrum), California horned lark (Eremophila alpestris actia), burrowing owl (Athene cunicularia) , and many other raptor species]. They also provide natural Habitat connections and restoration opportunities for native plant communities.
Semi-desert chaparral: Less than 0.1 acre of 19 acres (<0.1 %) of semi-desert chaparral would be conserved under the MSHCP. Of the four mapped patches of semi-desert chaparral, all occur on private lands outside the MSHCP Conservation Area, except for a small portion that overlaps with a narrow patch of Public/Quasi-Public Land. This Habitat is not common within the Plan Area, but is fairly common on the upper eastern slopes of the San Jacinto and Palomar Mountain ranges. Some areas of this Vegetation Community may have been lumped with undifferentiated chaparral in the eastern portion of the Plan Area. More detailed mapping of semi-desert chaparral would be required to determine if there is adequate representation in the MSHCP Conservation Area.
Southern Sycamore/Alder Riparian Woodland: Less than 69 acres of 190 acres (36.5%) of southern sycamore/alder riparian woodland would be conserved under the MSHCP. Southern sycamore/alder riparian woodland was mapped in 14 different patches ranging in size from 2 to 92 acres. The largest patch occurs on private lands in the Agua Tibia Mountains. Several of the smaller patches also occur on private lands in the southwestern portion of the Plan Area.
Coastal Scrub: A total of 1,894 acres of 4,678 acres (40.5%) of coastal scrub would be conserved under the MSHCP. Coastal scrub was mapped in three general localities in the Plan Area: within the San Bernardino National Forest south of the San Jacinto River, near Soboba Hot Springs, and in the Banning-Beaumont Pass area. The largest portion of coastal scrub occurs within the Pass region, and much of this vegetation type in this area occurs on Indian lands (955 acres). In addition, 848 acres of coastal scrub is present on Rural Mountainous lands in this area, and it is likely that some additional Conservation of coastal scrub would result in these areas.
Southern Willow Scrub: A total of 843 acres of 1,713 acres (49.2%) of southern willow scrub would be conserved by the MSHCP. Southern willow scrub is present in many small patches scattered throughout the western portion of the Plan Area. The majority of southern willow scrub not located within the MSHCP Conservation Area is concentrated within and just east of the City of Riverside.
3.3 Conservation within Bioregions
The total acreage and percentage of Conservation in the Additional Reserve Lands and existing Public/Quasi-Public Lands for each of the seven Bioregions is presented in Table 4. The table also shows the acreage and percentage of the Bioregions on Indian Land and designated Rural/ Mountainous land use. The portions of the Bioregions outside of the Additional Reserve Lands, Public/Quasi-Public Lands, Indian Lands and Rural/Mountainous designations have been categorized as "Out," and includes natural areas assumed to be eligible for future Development.
Large overall percentages and acreages of the Agua Tibia Mountains (80%, 10,130 acres), San Jacinto Mountains (72%, 134,000 acres), San Jacinto Foothills (65%, 72,240 acres) and the Santa Ana Mountains (61%, 85,810 acres) Bioregions would be conserved under the MSHCP. With the exception of the San Jacinto Foothills Bioregion, the majority of Conservation within these Bioregions is in existing Public/Quasi-Public Land. This Habitat is not common within the Plan Area, but is fairly common on the upper eastern slopes of the San Jacinto and Palomar Mountain ranges. Some areas of this Vegetation Community may have been lumped with undifferentiated chaparral in the eastern portion of the Plan Area. More detailed mapping of semi-desert chaparral would be required to determine if there is adequate representation in the MSHCP Conservation Area. The vast majority of the conserved lands in these Bioregions is natural vegetation. Urban and intensive agricultural lands account for less than 2% of the San Jacinto Mountains and Agua Tibia Mountains Bioregions and less than 15% of the Santa Ana Mountains and San Jacinto Foothills Bioregions.
TABLE 4
ACREAGE AND PERCENT CONSERVATION IN BIOREGIONS
| Bioregion | Additional Reserve Lands | Existing Public/Quasi-Public Lands | Total Conserved | Rural/ Mountainous | Indian Lands | Out | Total Acreage |
|
|---|---|---|---|---|---|---|---|---|
| Agua Tibia Mountains | acres | 1,070 | 9,060 | 10,130 | 250 | 590 | 1,630 | 12,610 |
| % | 8.5% | 71.8% | 80.3% | 2.0% | 4.7% | 12.9% | ||
| Desert Transition |
acres | 10,860 | 22,600 | 33,460 | 0 | 18,340 | 36,980 | 88,780 |
| % | 12.2% | 25.5% | 37.7% | 0% | 20.7% | 41.7% | ||
| Riverside Lowlands | acres | 85,900 | 80,920 | 166,820 | 47,430 | 8,650 | 466,880 | 689,780 |
| % | 12.5% | 11.7% | 24.2% | 6.9% | 1.3% | 67.7% | ||
| San Bernardino Mountains | acres | 850 | 9,140 | 9,990 | 3,650 | 8,370 | 6,980 | 28,990 |
| % | 2.9% | 31.5% | 34.5% | 12.6% | 28.9% | 24.7% | ||
| San Jacinto Foothills | acres | 49,690 | 22,550 | 72,240 | 15,330 | 4,190 | 19,990 | 111,750 |
| % | 44.5% | 20.2% | 64.6% | 13.7% | 3.7% | 17.9% | ||
| San Jacinto Mountains | acres | 11,120 | 122,880 | 134,000 | 11,130 | 2,620 | 39,170 | 186,920 |
| % | 5.9% | 65.7% | 71.7% | 6.0% | 1.4% | 21.0% | ||
| Santa Ana Mountains | acres | 6,450 | 79,360 | 85,810 | 39,650 | 0 | 14,430 | 139,890 |
| % | 4.6% | 56.7% | 61.3% | 28.3% | 0% | 10.3% | ||
| 1,258,720 | ||||||||
Lower percentages of the Desert Transition Bioregion (38%), San Bernardino Mountains Bioregion (35%) and Riverside Lowlands Bioregion (24%) would be conserved within the Plan Area. Much of the unconserved area in the Desert Transition and San Bernardino Mountains Bioregions is mapped as natural vegetation. Only 6% of the Desert Transition Bioregion is mapped as urban development and Agriculture, and 10% of the San Bernardino Mountains Bioregion is mapped as urban development and Agriculture. However, a substantial portion of unconserved area in these two Bioregions is Indian Land; 21% of the Desert Transition Bioregion and 29% of the San Bernardino Mountains Bioregion. The Riverside Lowlands, which is the largest Bioregion at approximately 690,000 acres, would have the lowest overall percentage of conserved area, with only 24% in the MSHCP Conservation Area. However, approximately 50% (about 347,800 acres) of the Bioregion is mapped as urban development and agricultural. Only 1% of the Riverside Lowlands Bioregion is Indian Land and 7% is designated as Rural/Mountainous land use.
The representativeness of the generalized Vegetation Communities to be conserved under the MSHCP also can be described in terms of their biogeographic distribution. This analysis allows for a finer-scale examination of conservation patterns to ensure that important vegetation types are being conserved throughout the Plan Area. For example, chaparral should be represented in the MSHCP Conservation Area in all of the Bioregions in order to capture the diversity of this Vegetation Community in the Plan Area.
3.3.1 Santa Ana Mountains Bioregion
The Santa Ana Mountains Bioregion comprises 11% of the Plan Area and supports nine of the 11 generalized vegetation types found within the area, with only montane coniferous forest and meadows and marshes not mapped within the Bioregion (Table 5). Eight of the nine vegetation types in the Bioregion would be conserved in the MSHCP Conservation Area. The distribution of non-natural land covers (agricultural land, developed or disturbed lands, and water) is also shown in Table 5.
The large majority of vegetation conserved in the Santa Ana Mountains Bioregion is chaparral (77%). Woodlands and forests, coastal sage scrub and grassland make up much of the other conserved vegetation (21%). The remaining vegetation or land cover types make up less than 4% of the MSHCP Conservation Area in this Bioregion.
TABLE 5
CONSERVATION OF VEGETATION COMMUNITIES
IN THE SANTA ANA MOUNTAINS BIOREGION.
| Vegetation Community | Additional Reserve Lands and Existing Public/Quasi-Public Lands |
Bioregion | Percent Conserved under MSHCP |
Change in Relative % Distribution |
||
|---|---|---|---|---|---|---|
| Acres | Relative % Distribution |
Acres | Relative % Distribution |
|||
| Chaparral | 65,939 | 76.8 | 85,516 | 61.1 | 77.1 | 15.7 |
| Woodlands and Forests | 7,354 | 8.6 | 11,100 | 7.9 | 66.3 | 0.7 |
| Coastal Sage Scrub | 5,349 | 6.2 | 12,506 | 8.9 | 42.8 | -2.7 |
| Grassland | 5,082 | 5.9 | 10,298 | 7.4 | 49.3 | -1.5 |
| Riparian Scrub, Woodland, Forest | 1,057 | 1.2 | 1,287 | 0.9 | 82.1 | 0.3 |
| Agricultural Land | 476 | 0.6 | 11,802 | 8.4 | 4.0 | -7.8 |
| Developed or Disturbed Land | 303 | 0.4 | 6,955 | 5.0 | 4.4 | -4.6 |
| Riversidean Alluvial Fan Sage Scrub | 211 | 0.2 | 334 | 0.2 | 63.2 | 0.0 |
| Playas and Vernal Pools | 31 | 0.0 | 31 | 0.0 | 99.8 | 0.0 |
| Desert Scrubs | 3 | 0.0 | 3 | 0.0 | 100.0 | 0.0 |
| Water | 1 | 0.0 | 38 | 0.0 | 1.9 | 0.0 |
| Peninsular Juniper Woodland and Scrub | 0 | 0.0 | 20 | 0.0 | 0.0 | 0.0 |
| TOTAL | 85,806 | 99.9 | 139,889 | 100.0 | 61% | |
Six of the vegetation types in this region have greater than 50% conservation: chaparral, woodlands and forests, riparian vegetation, Riversidean alluvial fan sage scrub, playas and vernal pools, and desert scrubs. Coastal sage scrub and grassland have lower conservation levels, at 43% and 49%, respectively. Overall conservation in the MSHCP Conservation Area is 61%. Excluding Agriculture and developed, overall conservation is 70%.
Chaparral is moderately over-represented in the MSHCP Conservation Area and coastal sage scrub and grassland are slightly under-represented. Juniper woodland and scrub, which comprises only 20 acres in the Bioregion, is not conserved. The other natural vegetation types have essentially the same percent representation in the Conservation Area as in the Bioregion. Agricultural land and developed or disturbed lands show reduced representation within the MSHCP Conservation Area.
3.3.2 Agua Tibia Mountains Bioregion
The Agua Tibia Mountains Bioregion comprises only 1% of the Plan Area, but supports eight of the 11 generalized vegetation types within the area. Overall, 80% of the Bioregion would be conserved, including almost 100% of Riversidean alluvial fan sage scrub, 77% of coastal sage scrub, 82% of the chaparral, and 76% of the grassland. Excluding Agriculture and developed, overall conservation is 81%.
All of the vegetation types would be represented in the MSHCP Conservation Area (Table 6). With regard to relative conservation, the dominant vegetation conserved in the Agua Tibia Mountains Bioregion by far is chaparral (87%), with grasslands, woodlands and forests, riparian vegetation, coastal sage scrub, Riversidean alluvial fan sage scrub and coniferous forest collectively making up only about 10% of the conserved vegetation. Chaparral would be slightly over-represented in the MSHCP Conservation Area in relation to its occurrence, but by-in-large, Conservation of natural Vegetation Communities is consistent with their occurrence in the Bioregion.
3.3.3 Riverside Lowlands Bioregion
The Riverside Lowlands Bioregion is by far the largest of the Bioregions, accounting for 55% of the Plan Area. Nine of the eleven generalized vegetation types are present within the Riverside Lowlands Bioregion and all of these are represented within areas to be conserved under the MSHCP (Table 7).
Unlike the Santa Ana and Agua Tibia Mountains Bioregions, the Riverside Lowlands Bioregion supports a more even distribution of vegetation types, with coastal sage scrub, chaparral, and grassland accounting for 16%, 12%, and 16% of the total land cover, respectively. The Riverside Lowlands Bioregion supports more existing Development and Agriculture than the other Bioregions, accounting for approximately 50% of the Bioregion. As shown in Table 7, however, the other natural vegetation types account for a substantial acreage of the Bioregion.
TABLE 6
CONSERVATION OF VEGETATION COMMUNITIES
IN THE AGUA TIBIA MOUNTAINS BIOREGION
| Vegetation Community | Additional Reserve Lands and Existing Public/Quasi-Public Lands |
Bioregion | Percent Conserved under MSHCP |
Change in Relative % Distribution |
||
|---|---|---|---|---|---|---|
| Acres | Relative % Distribution |
Acres | Relative % Distribution |
|||
| Chaparral | 8,793 | 86.7 | 10,675 | 84.7 | 82.4 | 4.3 |
| Grassland | 540 | 5.3 | 712 | 5.6 | 75.8 | -0.3 |
| Woodlands and Forests | 296 | 2.9 | 450 | 3.6 | 65.8 | -0.7 |
| Riparian Scrub, Woodland, Forest | 126 | 1.2 | 226 | 1.8 | 55.8 | -0.6 |
| Coastal Sage Scrub | 109 | 1.1 | 142 | 1.1 | 76.8 | 0.0 |
| Montane Coniferous Forest | 102 | 1.0 | 102 | 0.8 | 100.0 | 0.2 |
| Riversidean Alluvial Fan Sage Scrub | 63 | 0.6 | 63 | 0.5 | 99.8 | 0.1 |
| Developed or Disturbed Land | 62 | 0.6 | 96 | 0.8 | 64.6 | -0.2 |
| Agricultural Land | 37 | 0.4 | 126 | 1.0 | 29.4 | -0.6 |
| Meadows and Marshes | 11 | 0.1 | 11 | 0.1 | 100.0 | 0.0 |
| TOTAL | 10,139 | 99.9 | 12,605 | 100.0 | 80% | |
TABLE 7
CONSERVATION OF VEGETATION COMMUNITIES
IN THE RIVERSIDE LOWLANDS BIOREGION
| Vegetation Community | Additional Reserve Lands and Existing Public/Quasi-Public Lands |
Bioregion | Percent Conserved under MSHCP |
Change in Relative % Distribution |
||
|---|---|---|---|---|---|---|
| Acres | Relative % Distribution |
Acres | Relative % Distribution |
|||
| Coastal Sage Scrub | 50,565 | 30.3 | 108,614 | 15.7 | 46.6 | 16.3 |
| Chaparral | 33,668 | 20.2 | 83,355 | 12.1 | 40.4 | 8.1 |
| Grassland | 27,461 | 16.4 | 111,493 | 16.2 | 24.6 | 0.2 |
| Agricultural Land | 17,351 | 10.4 | 145,972 | 21.2 | 11.9 | -10.8 |
| Water | 9,570 | 5.7 | 11,113 | 1.6 | 86.1 | 4.1 |
| Developed or Disturbed Land | 8,970 | 5.4 | 201,841 | 29.3 | 4.4 | -23.9 |
| Riparian Scrub, Woodland, Forest | 8,017 | 4.8 | 10,756 | 1.6 | 74.5 | 3.2 |
| Playas and Vernal Pools | 6,720 | 4.0 | 7,882 | 1.1 | 85.3 | 2.9 |
| Riversidean Alluvial Fan Sage Scrub | 2,809 | 1.7 | 4,533 | 0.7 | 62.0 | 1.0 |
| Woodlands and Forests | 814 | 0.5 | 2,856 | 0.4 | 28.5 | 0.1 |
| Peninsular Juniper Woodland and Scrub | 517 | 0.3 | 926 | 0.1 | 55.8 | 0.2 |
| Meadows and Marshes | 342 | 0.2 | 402 | 0.1 | 85.1 | 0.1 |
| TOTAL | 166,804 | 99.9 | 689,744 | 100.0 | 24% | |
More than 50% of five of the vegetation types would be conserved under the MSHCP: riparian, playas and vernal pools, Riversidean alluvial fan sage scrub, juniper woodland, and meadows and marshes. The remaining four - chaparral, grassland, coastal sage scrub, and woodlands and forests - would have less than 50% conservation. Overall Conservation in the Bioregion would be 24%. However, excluding Agriculture and developed, overall conservation is 41%.
All of the natural vegetation types would be slightly to moderately over-represented in the MSHCP Conservation Area. Coastal sage scrub shows the largest relative increase, comprising 30% of the MSHCP Conservation Area compared to 16% of the Bioregion. The over-representation of natural vegetation in the MSHCP Conservation Area mostly is a result of the low percentage of Agriculture and developed in the area.
3.3.4 San Jacinto Foothills Bioregion
The San Jacinto Foothills Bioregion comprises 9% of the Plan Area and supports nine of the eleven generalized vegetation types within the area (Table 8). All of these types would be represented in the MSHCP Conservation Area.
Almost 50% of the Bioregion is chaparral, and chaparral and coastal sage scrub together comprise about 73% of the cover in the Bioregion. Grassland accounts for about 11% of the cover. As would be expected in this generally rugged and rural area, Agriculture and developed only account for about 9% of the total cover.
Overall conservation levels of natural Vegetation Communities in this Bioregion are high. With the exception of woodland and forest, the MSHCP Conservation Area includes more than 50% of each vegetation type. Overall conservation is 65%. Excluding Agriculture and developed, overall conservation is 68%.
Representativeness of the natural vegetation types in the MSHCP Conservation Area ranges from slightly under-represented (grassland at -2.5%) to slightly over-represented (coastal sage scrub at +3.5%), but generally representation in the MSHCP Conservation Area is consistent with representation in the Bioregion.
TABLE 8
CONSERVATION OF VEGETATION COMMUNITIES
IN THE SAN JACINTO FOOTHILLS BIOREGION
| Vegetation Community | Additional Reserve Lands and Existing Public/Quasi-Public Lands |
Bioregion | Percent Conserved under MSHCP |
Change in Relative % Distribution |
||
|---|---|---|---|---|---|---|
| Acres | Relative % Distribution |
Acres | Relative % Distribution |
|||
| Chaparral | 36,324 | 50.3 | 54,220 | 48.5 | 67.0 | 1.8 |
| Coastal Sage Scrub | 20,330 | 28.1 | 27,497 | 24.6 | 73.9 | 3.5 |
| Grassland | 6,142 | 8.5 | 12,264 | 11.0 | 50.1 | -2.5 |
| Desert Scrubs | 2,161 | 3.0 | 2,227 | 2.0 | 97.0 | 1.0 |
| Agricultural Land | 1,790 | 2.5 | 5,592 | 5.0 | 32.0 | -2.5 |
| Developed or Disturbed Land | 1,417 | 2.0 | 4,155 | 3.7 | 34.1 | -1.7 |
| Riparian Scrub, Woodland, Forest | 1,411 | 2.0 | 1,699 | 1.5 | 83.0 | 0.5 |
| Riversidean Alluvial Fan Sage Scrub | 1,212 | 1.7 | 1,378 | 1.2 | 88.0 | 0.5 |
| Woodlands and Forests | 710 | 1.0 | 1,953 | 1.7 | 36.4 | -0.7 |
| Water | 662 | 0.9 | 678 | 0.6 | 97.6 | 0.3 |
| Meadows and Marshes | 83 | 0.1 | 84 | 0.1 | 98.8 | 0.0 |
| Peninsular Juniper Woodland and Scrub | 2 | 0.0 | 2 | 0.0 | 100.0 | 0.0 |
| TOTAL | 72,243 | 100.1 | 111,750 | 100.0 | 65% | |
3.3.5 San Jacinto Mountains Bioregion
The San Jacinto Mountains Bioregion comprises 15% of the Plan Area. Ten of the eleven generalized vegetation types are present in the San Jacinto Mountains Bioregion. All of these types are also represented within areas to be conserved under the MSHCP (Table 9).
Similar to the other montane Bioregions, the San Jacinto Mountains Bioregion is largely dominated by chaparral vegetation, with this type accounting for 68% of the cover. Montane coniferous forest and woodlands and forests are sub-dominant vegetation types in the Bioregion, covering about 23% of the area. In contrast, coastal sage scrub and grassland, which are large upland components in the lowland and foothill Bioregions, account for only 5% of the Bioregion. Also reflecting the natural landscape of this Bioregion, Agriculture and developed account for only 1.4% of the cover.
TABLE 9
CONSERVATION OF VEGETATION COMMUNITIES
IN THE SAN JACINTO MOUNTAINS BIOREGION
| Vegetation Community | Additional Reserve Lands and Existing Public/ Quasi-Public Lands |
Bioregion | Percent Conserved under MSHCP |
Change in Relative % Distribution |
||
|---|---|---|---|---|---|---|
| Acres | Relative % Distribution |
Acres | Relative % Distribution |
|||
| Chaparral | 93,757 | 70.6 | 126,777 | 67.8 | 74.0 | -3.4 |
| Montane Coniferous Forest | 19,086 | 14.4 | 28,290 | 15.1 | 67.5 | -0.7 |
| Woodlands and Forests | 13,314 | 10.0 | 15,589 | 8.3 | 85.4 | 1.7 |
| Coastal Sage Scrub | 3,231 | 2.4 | 3,818 | 2.0 | 84.6 | 0.4 |
| Grassland | 1,781 | 1.3 | 5,454 | 2.9 | 32.7 | -1.6 |
| Desert Scrubs | 379 | 0.3 | 1,484 | 0.8 | 25.5 | -0.5 |
| Riparian Scrub, Woodland, Forest | 336 | 0.3 | 482 | 0.3 | 69.7 | 0.0 |
| Agricultural Land | 276 | 0.2 | 1,011 | 0.5 | 27.3 | -0.3 |
| Developed or Disturbed Land | 236 | 0.2 | 1,675 | 0.9 | 14.1 | -0.7 |
| Riversidean Alluvial Fan Sage Scrub | 193 | 0.1 | 331 | 0.2 | 58.3 | -0.1 |
| Water | 102 | 0.1 | 261 | 0.1 | 39.1 | 0.0 |
| Meadows and Marshes | 72 | 0.1 | 452 | 0.2 | 15.9 | -0.1 |
| Peninsular Juniper Woodland and Scrub | 15 | 0.0 | 15 | 0.0 | 100.0 | 0.0 |
| TOTAL | 132,778 | 100.0 | 185,637 | 99.3 | 72% | |
Conservation levels would be high in the San Jacinto Mountains Bioregion, with 72% conservation overall and 72% excluding Agriculture and developed. Conservation of individual vegetation types would be variable. Chaparral, coastal sage scrub, coniferous forest, woodlands and forests and riparian would all be conserved at levels of 67% or greater. Approximately 33% of grassland, 16% of meadows and marshes and 25% of desert scrub would be conserved.
Representativeness of vegetation types would range from slightly under-represented (-3.4% for chaparral) to slightly over-represented (+1.7% for woodlands and forests). Overall, the representativeness of natural vegetation types in the MSHCP Conservation Area would be consistent with their occurrence in the Bioregion.
3.3.6 Desert Transition Bioregion
The Desert Transition Bioregion comprises 7% of the Plan Area. It should be noted that 21% percent of the Desert Transition Bioregion is Indian Land (Table 4). Nine of the 11 generalized vegetation types occur in the Desert Transition Bioregion. All of these types occur within areas to be conserved under the MSHCP (Table 10).
TABLE 10
CONSERVATION OF VEGETATION COMMUNITIES
IN THE DESERT TRANSITION BIOREGION
| Vegetation Community | Additional Reserve Lands and Existing Public/Quasi-Public Lands |
Bioregion | Percent Conserved under MSHCP |
Change in Relative % Distribution |
||
|---|---|---|---|---|---|---|
| Acres | Relative % Distribution |
Acres | Relative % Distribution |
|||
| Chaparral | 26,905 | 80.4 | 56,898 | 64.1 | 47.3 | 16.3 |
| Desert Scrubs | 2,446 | 7.3 | 10,850 | 12.2 | 22.5 | -4.9 |
| Coastal Sage Scrub | 2,059 | 6.2 | 2,792 | 3.1 | 73.7 | 3.1 |
| Grassland | 1,478 | 4.4 | 10,098 | 11.4 | 14.6 | -7.0 |
| Developed or Disturbed Land | 130 | 0.4 | 2,030 | 2.3 | 6.4 | -1.9 |
| Riversidean Alluvial Fan Sage Scrub | 124 | 0.4 | 378 | 0.4 | 32.7 | 0.0 |
| Riparian Scrub, Woodland, Forest | 113 | 0.3 | 304 | 0.3 | 37.2 | 0.0 |
| Woodlands and Forests | 94 | 0.3 | 223 | 0.3 | 42.2 | 0.0 |
| Pennisular Juniper Woodland and Scrub | 76 | 0.2 | 120 | 0.1 | 63.0 | 0.1 |
| Meadows and Marshes | 33 | 0.1 | 1,258 | 1.4 | 2.6 | -1.3 |
| Agricultural Land | 4 | 0.0 | 3,718 | 4.2 | 0.1 | -4.2 |
| Water | 4 | 0.0 | 116 | 0.1 | 3.4 | -0.1 |
| TOTAL | 33,467 | 100.1 | 88,785 | 100.0 | 38% | |
Chaparral is the most common vegetation type within the Desert Transition Bioregion, comprising 64% of the cover, with much smaller amounts of desert scrubs (12%), grassland (11%), and coastal sage scrub (3%). Agriculture and developed account for 4% and 2% of the cover, respectively.
Because a substantial percentage of the Bioregion is Indian Land (21%), only 38% of the overall Bioregion would be conserved. Excluding Agriculture and developed, 40% of the Bioregion would be conserved. If Indian Land is excluded from the total, 48% of the Bioregion would be conserved. More than 50% of coastal sage scrub, chaparral, Riversidean alluvial fan sage scrub, woodlands and forests, and juniper woodland would be conserved. Almost 50% of riparian scrub, woodland, and forest would be conserved. Only 23% of grassland would be conserved because a large portion of this community occurs on Indian Lands. A relatively low percentage of meadows and marshes would be conserved (25%).
Representativeness of vegetation types in the Desert Transition Bioregion is variable, ranging from moderate under-representation (grassland at -7.0%) to moderate over-representation (chaparral at +16.3%). Again, this is because a large percentage of the Bioregion is Indian Land.
3.3.7 San Bernardino Mountains Bioregion
The San Bernardino Mountains Bioregion accounts for 2% of the Plan Area. Eight of the eleven generalized vegetation types occur in this Bioregion, and all are represented within areas to be conserved under the MSHCP (Table 11). About 29% percent of the Bioregion is Indian Land.
TABLE 11
CONSERVATION OF VEGETATION COMMUNITIES
IN THE SAN BERNARDINO MOUNTAINS BIOREGION
| Vegetation Community | Additional Reserve Lands and Existing Public/ Quasi-Public Lands |
Bioregion | Percent Conserved under MSHCP |
Change in Relative % Distribution |
||
|---|---|---|---|---|---|---|
| Acres | Relative % Distribution |
Acres | Relative % Distribution |
|||
| Chaparral | 6,879 | 68.8 | 17,496 | 60.3 | 39.3 | 8.5 |
| Montane Coniferous Forest | 1,311 | 13.1 | 1,514 | 5.2 | 86.6 | 7.9 |
| Riversidean Alluvial Fan Sage Scrub | 621 | 6.2 | 926 | 3.2 | 67.1 | 3.0 |
| Grassland | 333 | 3.3 | 3,820 | 13.2 | 8.7 | -9.9 |
| Woodlands and Forests | 302 | 3.0 | 1,051 | 3.6 | 28.7 | -0.6 |
| Developed or Disturbed Land | 244 | 2.4 | 1,512 | 5.2 | 16.1 | -2.8 |
| Riparian Scrub, Woodland, Forest | 137 | 1.4 | 273 | 0.9 | 50.2 | 0.5 |
| Coastal Sage Scrub | 71 | 0.7 | 1,077 | 3.7 | 6.6 | -3.0 |
| Agricultural Land | 90 | 0.9 | 1,254 | 4.3 | 7.2 | -3.4 |
| Meadows and Marshes | 4 | 0.0 | 74 | 0.3 | 5.4 | -0.3 |
| TOTAL | 9,992 | 99.9 | 28,997 | 100.0 | 35% | |
Chaparral vegetation covers 60% of the Bioregion. Grassland is the next most common vegetation, accounting for 13% of the Bioregion. The remaining natural Vegetation Communities each account for less than 6% of the cover. Agriculture and developed combined account for less than 10% of the Bioregion.
Overall, conservation would be 35%, and 37% excluding Agriculture and developed. Excluding Indian Land, 48% of the Bioregion would be conserved. Four of the vegetation types would be conserved at levels greater than 50%: montane coniferous forest (87%), Riversidean alluvial fan sage scrub (84%), riparian (75%), and chaparral (58%). Relatively low conservation would occur for grassland (15%), woodlands and forest (33%), coastal sage scrub (20%), and meadows and marshes (7%).
Representativeness of vegetation types in this Bioregion range from moderately under-represented (grassland at -9.9%) to moderately over-represented (chaparral at +8.5%). Coastal sage scrub and grassland, in particular, appear to be substantially under-represented in the MSHCP Conservation Area. Of the 1,077 acres of coastal sage scrub in the Bioregion, only 71 acres (7%) would be conserved. Of the 3,820 acres of grassland, only 333 acres (9%) would be conserved.
3.3.8 Summary of Bioregions Analysis
Vegetation types within each of the Bioregions generally are well represented. Thus, it can be concluded that vegetation types and their distribution within the Plan Area also are adequately represented (Again, note that this does not imply adequate Conservation for Habitats, species and ecosystem function. However, adequate representation is assumed to be a prerequisite for adequate conservation. Plan Area-wide, chaparral is generally over-represented (+12.4% combined for the Plan Area) and grassland is generally under-represented (-6.3% combined for the Plan Area) (Table 2). Coastal sage scrub, woodlands and forest, montane coniferous forest, riparian, playas and vernal pools, Riversidean sage scrub and peninsular juniper woodland and scrub are all neutral or slightly over-represented in the MSHCP Conservation Area (Table 2). Apart from grassland, desert scrubs is the only other natural vegetation slightly under-represented in the Conservation Area (-0.4%). This generally positive representativeness of natural Vegetation Communities across Bioregions will be important for maintaining species diversity and ecosystem function.
3.4 Soils
To aid in conservation area delineation and evaluation, certain soil types known to be associated with listed and sensitive plant species in certain regions of the Plan Area were digitized. Two general classes of soils were digitized: clay soils and Traver-Domino-Willows association soils. Soils maps from the Soil Survey of Western Riverside Area, California (Knecht 1971) were used. It should be understood that the soil maps are at least 30 years old, are not rectified and linework does not necessarily match real topography. They do, however, provide an overview of where important soils generally occur in the Plan Area. (According to the Soil Conservation Service, the soils in Riverside County will be digitized over the next two years using newer flown and rectified aerials.)
The area for which the soils were digitized ranges from north of Lake Mathews in the northwest, east to the San Jacinto River and Hemet, south to Temecula, and southwest to Lake Elsinore and Alberhill. Based on the general soil map, the Traver-Domino-Willows association is well covered by this mapping effort (Exhibit 5). The only missing area of the Traver-Domino-Willows association is a mapping unit in the La Sierra area north of the Riverside Freeway (Highway 91).
Clay soils digitized within the Plan Area included the Bosanko, Auld, Altamont, and Porterville series (Exhibit 5). In addition, areas from which clay had been mined in the Alberhill area (known as "clay pit") were digitized. Within the Plan Area, clay soils support several listed threatened or endangered species: Munz's onion (Allium munzii), thread-leaved brodiaea (Brodiaea filifolia) and San Diego button celery (Eryngium aristulatum var. parishii). Other sensitive plant species occurring on clay soils include, Orcutt's brodiaea (Brodiaea orcuttii), long-spined spineflower (Chorizanthe polygonoides var. longispina), small-flowered morning glory (Convolvulus simulans), many-stemmed dudleya (Dudleya multicaulis), Palmer's grapplinghook (Harpagonella palmeri), graceful tarplant (Holocarpha virgata ssp. elongata), and small-flowered microseris (Microseris douglasii ssp. platycarpha).
The Traver-Domino-Willows association includes saline-alkali soils largely located along floodplain areas of the San Jacinto River (including the inlet to Lake Elsinore) and Salt Creek within the Plan Area (Exhibit 5). Sensitive plants supported by the Traver-Domino-Willows soil association include two federally-listed species: San Jacinto Valley crownscale (Atriplex coronata var. notatior) and spreading navarretia (Navarretia fossalis). Other sensitive plant species found in this association include Parish's brittlescale (Atriplex parishii), Davidson's saltscale (Atriplex serenana var. davidsonii), and vernal barley (Hordeum intercedens).
Table 12 below summarizes the number of acres and percent conserved of mapped sensitive soils within the MSHCP Conservation Area, existing Public/Quasi-Public Lands, and areas designated as Rural/Mountainous land use. The remaining areas are categorized as "Out" in Table 12. None of the soils were mapped on Indian Land.
TABLE 12
ACREAGE AND PERCENT CONSERVED OF SELECT SENSITIVE SOILS
| Additional Reserve Lands |
Existing Public/ Quasi-Public Lands |
Total Conserved |
Rural/ Mountainous |
Out | Total Acreage |
||
|---|---|---|---|---|---|---|---|
| Clays | |||||||
| Altamont | acres | 315 | 0 | 315 | 0 | 570 | 885 |
| % | 36 | 0 | 36 | 0 | 64 | ||
| Auld | acres | 170 | 297 | 467 | 15 | 974 | 1,456 |
| % | 12 | 20 | 32 | 0 | 67 | ||
| Bosanko | acres | 191 | 420 | 611 | 3 | 1,499 | 2,113 |
| % | 9 | 20 | 29 | 0 | 71 | ||
| Clay Pit | acres | 254 | 15 | 269 | 0 | 583 | 852 |
| % | 30 | 2 | 32 | 0 | 68 | ||
| Porterville | acres | 96 | 894 | 990 | 47 | 2,140 | 3,177 |
| % | 3 | 28 | 31 | 1 | 67 | ||
| Total Clays | acres | 1,026 | 1,626 | 2,652 | 65 | 5,766 | 8,483 |
| % | 12 | 19 | 31 | <1 | 68 | ||
| Traver-Domino-Willows Association | |||||||
| Domino | acres | 610 | 1,445 | 2,055 | 0 | 9,648 | 11,703 |
| % | 5 | 12 | 17 | 0 | 82 | ||
| Traver | acres | 1,998 | 1,225 | 3,223 | 0 | 6,802 | 10,025 |
| % | 20 | 12 | 32 | 0 | 68 | ||
| Willows | acres | 3,561 | 1,701 | 5,262 | 0 | 1,804 | 7,066 |
| % | 50 | 24 | 74 | 0 | 26 | ||
| Total T-D-W Association | acres | 6,169 | 4,371 | 10,540 | 0 | 18,254 | 28,794 |
| % | 21 | 15 | 36 | 0 | 63 | ||
A total of 8,483 acres of clay soils was digitized. Approximately 2,652 acres (31%) of the total acreage of mapped clay soils would be conserved under the MSHCP, including 12% within the MSHCP Conservation Area and 19% on existing Public/Quasi-Public Lands. Of the conserved clays soils, 12% are comprised of the Altamont series, 18% of the Auld series, 23% of the Bosanko series, 37% of the Porterville series and 10% of clay pit.
A total of 28,794 acres of the Traver-Domino-Willows association was digitized. Approximately 10,540 acres (36%) of mapped soils of this association would be conserved under the MSHCP, including 17% of the Domino series, 32% of the Traver series, and 74% of the Willows series. Of the conserved soils in the Traver-Domino-Willows association, 19% are comprised of the Domino series, 31% of the Traver series, and 50% of the Willows series.
3.5 MSHCP Conservation Area Patch Size, Shape and Edge Effects
Size, shape, and spatial character are crucial factors integral to the long-term health and function of a biological reserve. A fundamental concept of conservation biology derived from island biogeography theory (MacArthur and Wilson 1967) is that patch or reserve size is important because larger reserves generally encompass a greater contiguous portion of the landscape and include a larger variety of Habitats and ecological niches than smaller reserves. Large reserves also provide greater protection for species against catastrophic events (e.g., fires, flooding, and other human induced environmental changes) by including areas less likely to be affected by these events. The
unaffected areas also may provide temporary refuge for species that can later colonize the affected area (e.g., gnatcatchers eventually colonize burned coastal sage scrub as long at it does not type-convert to annual grassland).
While in theory large reserves usually are considered superior to smaller "satellite" reserves, several smaller reserves cumulatively may contain higher biological diversity by efficiently preserving nodes of Vegetation Communities or plant and wildlife species with limited distributions (e.g., narrow endemics). Also, several smaller reserves may provide a hedge against catastrophic events that can devastate a single, large reserve. In conservation biology theory, this is known as the "single large or several small" reserves (SLOSS) tradeoff. In practice, reserves often must include both small and large reserve areas in order to preserve the greatest number and diversity of Vegetation Communities, Habitats and species.
With regard to reserve shape, large areas approaching a circular shape provide the maximum area-to-perimeter ratio. In terms of reserve function, this translates to the amount of the urban/Habitat edge relative to the amount of "interior" Habitat (i.e., Habitat relatively unaffected by edge and presumably higher Habitat value). The extent that Habitats blocks are fragmented by urban and agricultural land uses is directly related to the ratio of Habitat edge to Habitat interior (the perimeter to area ratio). In general, urban Edge Effects on Habitat and wildlife are negative and may be classified as having four broad effects: (1) increased predation by mesopredators (e.g., striped skunks, opossum, raccoon and domestic cats); (2) direct and indirect competition from exotic plant and animal species; (3) increased fire frequency; and (4) local or small-scale environmental changes in temperature, light, and wind (Primack 1993). Other Edge Effects may include human intrusion and disturbances (off-road vehicles, various other recreational activities, dumping, shooting), and urban runoff including pesticides and other toxic materials.
The interface between urban/agricultural development and natural Habitats represents an area of complex interactions among at least three suites of plant and wildlife species: (1) "Core Area" species that are sensitive to edge factors; (2) species that occur primarily within Core Areas, but that are not highly sensitive to Edge Effects; and (3) edge species that preferentially inhabit edge boundaries. Along urban and agricultural boundaries, edge species typically are aggressive, Habitat altering and persistent colonizers of other Habitats. Many of these species are non-natives that displace or may directly prey on native species (e.g., domestic cats). Edge species are known to be detrimental to native species diversity, although specific effects depend on the local suite of species (e.g., Andren and Angelstam 1988; Brittingham and Temple 1983; Gates and Gysel 1978; Alberts et al. 1993; Sauvajot and Buechner 1993; Scott 1993; Wilcove 1985).
Disturbance estimates of urban/agricultural Edge Effects range from between 15 meters to 5 kilometers (Laurance 1991). Because of the complexity involved in estimating the Edge Effects over a regional landscape with a wide variety of different urban and agricultural development, as well as broad variation in Habitats and associated ecological systems, no specific distances for Edge Effects have been tested and established for the Habitats and land uses in the Plan Area. An example of a practical application of presumed Edge Effects, and based on review of the literature pertinent to the southern California region, the City of San Diego Multiple Species Conservation Program (MSCP) GIS model used three zones of decreasing Edge Effects: 150, 300, and 600 feet. Although these distances are somewhat arbitrary they provide a conceptual method of identifying areas that may incur Edge Effects. This method can also provide a means to compare existing conditions within the overall Plan Area with the proposed MSHCP Conservation Area.
The following sections describe analyses of patch size, shape and edge for the proposed MSHCP Conservation Area.
3.5.1 Methods for Measuring Habitat Patch Size
The proposed MSHCP Conservation Area would be an approximately 500,000-acre network of land that includes approximately 347,000 acres of existing Public/Quasi-Public Lands and approximately153,000 acres of Additional Reserve Lands. Portions of Rural/Mountainous areas also may contribute the MSHCP Conservation Area, but they are not within actual Conservation Area boundaries and thus are not be formally analyzed here.
MSHCP Conservation Area patch number, size and distribution were analyzed by combining available GIS data, including the vegetation map, existing biological open space within the existing Public/Quasi-Public Lands coverage and a Conceptual Reserve Design that was used for the conservation analysis. (It should be noted that the Conceptual Reserve Design is a conceptual portrayal of the assembled Criteria-based reserve that was necessary to conduct GIS analyses. For this analysis the conceptual MSHCP Conservation Area is approximately 480,000 acres, or about 4% smaller than the proposed 500,000 acre MSHCP Conservation Area. This difference is due to the fact that agricultural and disturbed or developed areas were not considered patches of Habitat for the purposes of this analysis.) The existing Public/Quasi-Public Lands data base was compiled from a variety of sources and includes parcel-level mapping for open space within urban areas and more generalized mapping in the National Forests and generally undeveloped rural areas. Within urban areas, open space boundaries were sufficiently detailed to depict small-scale Development, including local roads, Agriculture and urban development.
One change was made to the MSHCP Conservation Area for the purpose of this analysis. Major roadways (primarily four- and six-lane roadways) were intersected with the MSHCP Conservation Area to depict potentially constrained Habitat connections between open spaces. Major roadways included all Interstate and State highways, except for State Highways 74, 79, 243, and 371 in the National Forests since they are primarily two-lane roads in these areas. It was assumed for this analysis that the typical two-lane paved road or single lane dirt road is not an obstacle to wildlife use and movement. Clearly this assumption is not true for all wildlife species. Ideally, patch size analyses would have to be tailored to the species being considered.
Discrete Habitat patches were defined by separations between natural Vegetation Communities by major roadways (as described above), urban and disturbed land covers, and intensive agricultural (dairies, intensive row crops and orchards). There was no minimum connection width or length between patches that defined the patches as separate; i.e., all continuous Habitat polygons were considered a single patch.
3.5.2 Results of the Habitat Patch Analysis
The MSHCP Conservation Area, including Additional Reserve Lands and existing Public/Quasi-Public Lands, is composed of approximately 575 patches of intact vegetation. The spatial character of the Conservation Area is complex, with a large number of small, spatially disjunct patches and a relatively small number of large connected patches (Table 13). (This may seem to be a trivial result, because one could logically assume there would only be a few large Habitat patches without doing the analysis. However, quantifying the distribution of patch sizes is useful, because one could conceive of a MSHCP Conservation Area that is comprised of a large number of small patches and no large patches).
TABLE 13
NUMBER AND ACREAGE OF NATURAL VEGETATION PATCHES
WITHIN THE MSHCP CONSERVATION AREA
| Size Class Intervals (Acres) |
Number of Patches |
% of Patches |
Number of Acres |
% of Acres |
|---|---|---|---|---|
| <1 | 189 | 33% | 56 | 0.01% |
| 1 to 10 | 187 | 32% | 714 | 0.2% |
| 11 to 100 | 116 | 20% | 3,881 | 0.8% |
| 101 to 1,000 | 55 | 10% | 21,975 | 4.6% |
| 1,001 to 10,000 | 21 | 4% | 79,354 | 16.5% |
| > 10,000 | 7 | 1% | 373,628 | 77.9% |
| TOTAL | 575 | 100% | 479,608 | 100% |
Although 65% of the vegetation patches in the MSHCP Conservation Area are less than 10 acres in size, they comprise only 0.2% of the area of the proposed MSHCP Conservation Area. The vast majority of these small patches occur within areas heavily fragmented by urbanized areas in the Riverside Lowlands Bioregion. By contrast, only 28 (5%) of the patches are greater than 1,000 acres in size, but these comprise 94% of the proposed MSHCP Conservation Area. A single intact Habitat block comprises approximately 238,000 acres (50%) of the area.
3.5.3 Methods for Measuring Edge Effects
Edge areas were calculated using the vegetation data base, the Bioregions coverage, highways, the proposed MSHCP Conservation Area and existing Public/Quasi-Public Lands. These polygon-based data layers were converted to 100-foot pixel grids for the quantitative analysis. The Edge Effects analysis was conducted both for the existing conditions in the Plan Area and for the anticipated "buildout" scenario after assembly of the MSHCP Conservation Area. Lands were either classified as natural Habitat or urban/agricultural under the existing conditions and buildout scenarios. For the buildout scenario, it was conservatively assumed that all non-MSHCP Conservation Area lands, including Rural/Mountainous, would be converted to urban development or Agriculture. A distance function then was used to measure the distance from urban or agricultural lands to each cell supporting land mapped as Habitat. Lands were classified under one of the three following edge categories:
- < 250 feet - high edge
- 251 to 600 feet - moderate edge
- > 600 feet - low to no edge.
Again, these edge intervals are somewhat arbitrary and are not meant to reflect the absolute Edge Effects in the Plan Area but are consistent with those used for the San Diego MSCP.
3.5.4 Results of Edge Effects Analysis
The results of the edge analysis are summarized in Table 14. This summary includes the existing conditions in the Plan Area and the potential future condition in the Plan Area assuming complete buildout in non-MSHCP Conservation Area lands. In addition, the table shows a comparison of existing conditions and buildout conditions with an idealized single circular block of Habitat as a Core Area that is the same size as the proposed MSHCP Conservation Area, and excludes any developed, disturbed and agricultural lands that would cause internal edge.
TABLE 14
RESULTS OF EDGE ANALYSIS
| Edge Category | Existing Plan Area | Plan Area after Buildout | Circle (theoretical shape) | |||
|---|---|---|---|---|---|---|
| Acres | % | Acres | % | Acres | % | |
| Urban/Agricultural Land | 420,671 | - - | 779,293 | - - | - - | - - |
| < 250 feet (high edge) | 114,260 | 14 | 51,645 | 11 | 2,576 | < 1 |
| 251 to 600 feet (moderate edge) | 126,005 | 15 | 72,107 | 15 | 4,316 | < 1 |
| > 600 feet (low or no edge) | 597,812 | 71 | 355,703 | 74 | 481,467 | 99 |
| Total Acres | 1,258,748 | - - | 1,258,748 | - - | 488,359 | - - |
Under existing conditions in the Plan Area, approximately 29% of the area is subject to high or moderate edge, and 71% has low or no edge. Under buildout of the MSHCP Conservation Area, the amount of high and moderate edge would be reduced to about 26% of the area, while the area with low or no Edge Effect would increase to 74% of the Plan Area. The reduction in high and moderate edge reflects the focus on developing currently fragmented Habitat and conserving existing areas with low or no current edge. In other words, it reflects the focus of Conservation on existing large, intact Habitat areas. Typically the ratio of edge-affected lands is lower with larger Habitat areas. However, because much of the urban portion of the Plan Area has many existing Habitat fragments, the Conservation of less fragmented Habitat in the MSHCP Conservation Area results in an improvement in the configuration of the MSHCP Conservation Area with respect to Edge Effects, even though the overall acreage of natural Habitats is reduced in the MSHCP Conservation Area buildout scenario.
As described above, an ideal reserve design for minimizing the edge-to-area ratio is a perfect circle. As shown in Table 14, a circle with roughly the same area as the proposed MSHCP Conservation Area would have almost 99% percent of its area unaffected by edge.
The spatial distribution and acreages of edge-affected lands under the MSHCP Conservation Area by Bioregion is shown in Table 15.
TABLE 15
EDGE-AFFECTED LANDS BY BIOREGIONS (ACRES)
| Bioregion | Urban/ Agriculture |
< 250 Ft | 251-600 Ft | > 600 Ft | Total Acres | |
|---|---|---|---|---|---|---|
| Santa Ana Mountains | Acres | 54,834 | 5,865 | 8,252 | 70,857 | 84,974 |
| % | - - | 7% | 10% | 83% | - - | |
| San Jacinto Foothills | Acres | 42,735 | 9,490 | 6,203 | 53,325 | 69,018 |
| % | - - | 14% | 9% | 77% | - - | |
| Agua Tibia Mountains | Acres | 2,568 | 541 | 927 | 8,551 | 10,019 |
| % | - - | 5% | 9% | 85% | - - | |
| Riverside Lowlands | Acres | 549,572 | 27,196 | 33,490 | 79,419 | 140,105 |
| % | - - | 19% | 24% | 57% | - - | |
| San Jacinto Mountains | Acres | 54,648 | 7,677 | 12,943 | 111,612 | 132,232 |
| % | - - | 6% | 10% | 84% | - - | |
| Desert Transition | Acres | 55,419 | 2,622 | 4,645 | 26,058 | 33,325 |
| % | - - | 8% | 14% | 78% | - - | |
| San Bernardino Mountains | Acres | 19,346 | 1,532 | 2,346 | 5,744 | 9,622 |
| % | - - | 16% | 24% | 60% | - - |
Although the MSHCP Conservation Area would have proportionally less edge than the existing Plan Area, it would still have a significant portion of edge-affected land. This primarily is due to Conservation of lands in the already fragmented Riverside Lowlands Bioregion. The San Bernardino Mountains Bioregion also has a high proportion of land subject to Edge Effects. The San Jacinto, Agua Tibia, and Santa Ana mountains, a large part of which are National Forest, would have the least amount of edge.
4.0 LITERATURE CITED
Alberts, A.A., A.D. Richman, D. Tran, R. Sauvajot, C. McCalvin and D.T. Bolger. 1993. Pages 103-110 in Keeley, J.E., editor. Interface Between Ecology and Land Development in California. Southern California Academy of Sciences, Los Angeles.
Andren, H. and T. Anglestam. 1988. Elevated predation rates as an edge effect in Habitat islands: experimental evidence. Ecology 69:544-547.
Brittingham, M.C. and S.A. Temple. 1983. Have cowbirds caused forest songbirds to decline? Bioscience 33:31-35.
Gates, J.E. and L.W. Gysel. 1978. Avian nest dispersion and fledgling success in field-forest ecotones. Ecology 59:871-883.
Holland, R.F. 1986. Preliminary Descriptions of the Terrestrial Natural Communities of California. State of California the Resources Agency Department of Fish and Game.
Knecht, A.A. 1971. Soil Survey of Western Riverside Area, California. U.S. Department of Agriculture, Washington, D.C.
Lawrence, W.F. 1991. Edge Effects on Tropical Forest Fragments. Application of a model for the design of nature reserves. Biological Conservation 57:205-219.
MacArthur, R.H. and E.O. Wilson. 1967 The Theory of Island Biogeography. Princeton University Press, Princeton, NJ.
Primack, R.B. 1993. Essentials of Conservation Biology. Sinauer Associates Inc. Sunderland Massachusetts, USA.
PSBS 1995. Western Riverside County Multi-Species Habitat Conservation Plan-Phase 1 Information Collection and Evaluation. Published for the Western Riverside County Habitat Consortium, Riverside County, CA.
Sauvejot, R.M. and M. Buechner. 1993. Effects of urban encroachment on wildlife in the Santa Monica Mountains. Pages 171-180 in Keeley, J.E., editor. Interface Between Ecology and Land Development in California. Southern California Academy of Sciences, Los Angeles.
Scott, T.A. 1993. Along the wildland urban interface. Pages 181-187 in Keeley, J.E., editor. Interface Between Ecology and Land Development in California. Southern California Academy of Sciences, Los Angeles.
Simberloff, D. and J. Cox 1987. Consequences and costs of conservation corridors. Conservation Biology 1:63-71.
USFWS. 2001. Endangered and Threatened Wildlife and Plants; Final designation of critical habitat for the arroyo toad; Final Rule. Federal Register 66: 9414-9474.
Whittaker, R.H. 1975. Communities and Ecosystems, 2nd edition. MacMillan, New York.
Wilcove, D.S. 1985. Nest predation in forest tracts and the decline of migratory songbirds. Ecology 66:1212-1214.